Lactate Testing
Optimise Your Training
Lactate testing and knowing your zones is a good idea no matter what time of year. However, with a lot of athletes just coming back from their off-season, now is a GREAT time to test.
With fitness likely dropping (and it should be!!) this is a key period to get your zones right and make the most of this winter period, building the foundation for a quality season next year.
This isn’t to maximise everything and train REALLY HARD. Often, quite the opposite. Getting lactate testing and setting your zones will help you avoid training too hard…A VERY COMMON MISTAKE at this time of year.
What is Lactate Testing
The basics of testing are quite straightforward. It requires a lactate analyser and test strips. HOWEVER, getting good reliable data and knowing what to do with it is not so easy.
Equipment
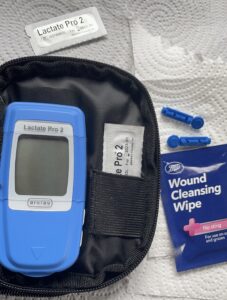
For testing, you need:
- Lactate Analyser
- Lactate Testing Strips
- Lancets and Pen
- Clean Gauze
- Alcohol wipes
A Quick Overview of the process
There are lots of things to know about testing that require careful monitoring and interpreting the results. But the physical process I follow to get good consistent results is as follows:
- Clean hands before starting the test
- Insert a test strip into the analyser
- Clean area to be used with an alcohol wipe
- Dry area with clean gauze
- Draw a drop of blood with a lancet/pen
- Wipe away the first drop of blood with clean gauze
- Test the second drop of blood by piercing the droplet with the test strip.
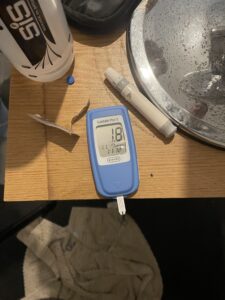
The key with the test is to create a lovely domed drop of blood…don’t test it if it loses shape and spills out over the skin. Try to use minimal force and pierce the droplet without touching the skin. This process helps avoid contamination that will alter results.
Testing Protocols
There are many protocols out there. More than I can cover here. The most common will be ramp tests, with different stages at ever-increasing power.
Personally, I use 5-minute stages to allow enough time for the blood lactate to stabilise at each power level.
I usually start at around 100 Watts and increase each 5-minutes, usually increasing by between 15 and 25 watts each stage, depending on the level of the athlete.
You don’t have to go to failure, but you can. This protocol will give you a good couple of stages with low lactate and give you a clear picture of the athlete’s profile as the intensity increases, and the curve of the lactate rises to match it.
The Raw Data
Collect your data in a simple table (I use excel).
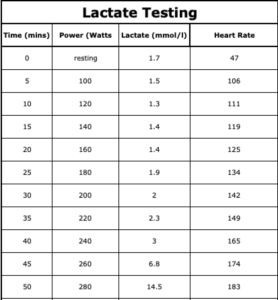
Once you’ve filled in the table with HR and Lactate data, you can create the curve,
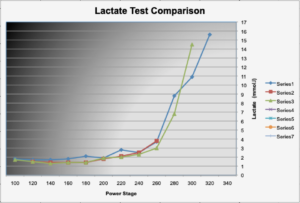
Interpreting the Data
I’m going to break this down into two parts.
- Self-analysis
- Modelled analysis
The first thing to do is to look at the shape of the curve. There are lots of points you can try to identify.
- LT1
- LT2
- Dmax
- Modified Dmax
- 2 mmol.l point
- 4 mmol.l point
- 1 mmol.l increase above resting
To a degree, it depends on what you believe in as to what you will look at. Also, it may depend on the event as to which markers you feel are most important to your athlete.
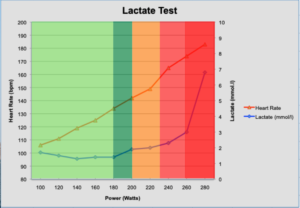
This graph is from a different test, but I’ve overlayed the 5-zone model, which is very useful for planning training sessions and looking at the areas you want to improve.
Modelled Analysis
There are many models that can interpret the data for you. Most are derived from the work of A. Mader and his colleagues at Cologne University. To name a couple of the models, there’s Jan Olbrechts swimming model, Sebastian Weber’s InScyd model (lactate or power-based model), Aerotune (power-based model) and Shannon Grady (Lactate Revolution).
It’s all interesting stuff, and all have a slightly different way of doing it.
Having recently been doing a lot more lactate testing, I’ve been mainly using my own analysis. But I am very keen on the modelling approach, and I’ve recently started working with Shannon Grady’s model. But it’s too early to feedback as yet.
Any questions, email coach@summitcyclecoaching.co.uk


